Pareto Chart
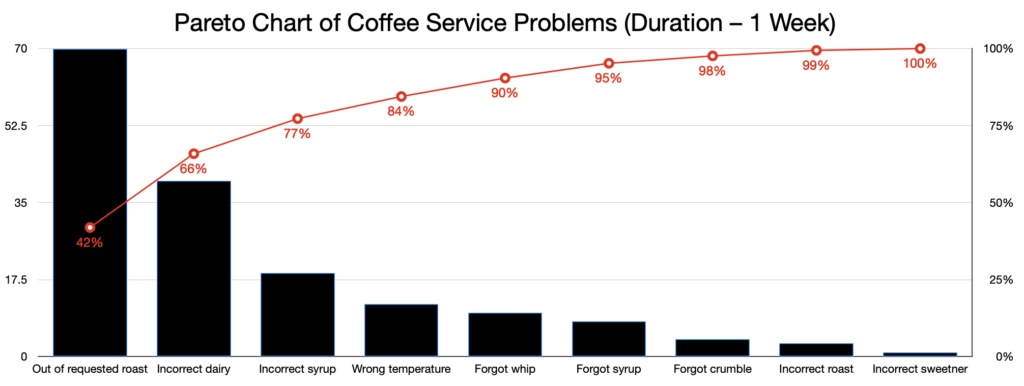
A Pareto chart is a method of displaying data to prioritize problem-solving. A single chart includes two visuals:
- Bar chart showing the frequency of occurrence of a series of causes
- Line chart showing the cumulative percentage of the same causes of problems
The term comes from Vilfredo Pareto (1848-1923), who coined the 80/20 rule. Pareto’s first statement of this rule was based on the discovery that throughout history 80% of the wealth in societies was controlled by 20% of the population. Joseph Juran later (1941) extended the 80/20 rule to quality problems where he found that 80% of a problem is typically caused by 20% of the possible causes. And today the 80/20 rules seems to find application in practically every activity.