Value Stream Mapping
Value-stream mapping (VSM) is diagraming every step involved in the material and information flows needed to bring a product from order to delivery. It is a fundamental tool used in continuous improvement to identify and eliminate waste. Toyota developed the tool — which it calls a material and information flow diagram — and it is a critical part of the Toyota Production System.
A value stream is all the actions (both value-creating and non value-creating) required to bring a product from raw material to the arms of the customer.
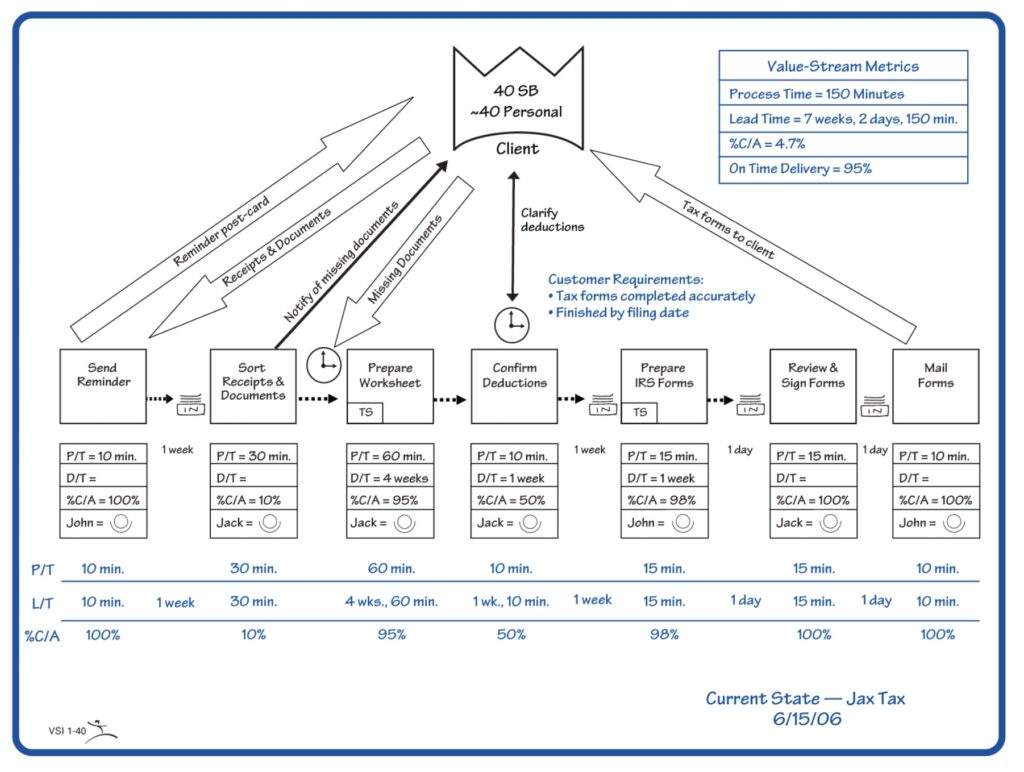
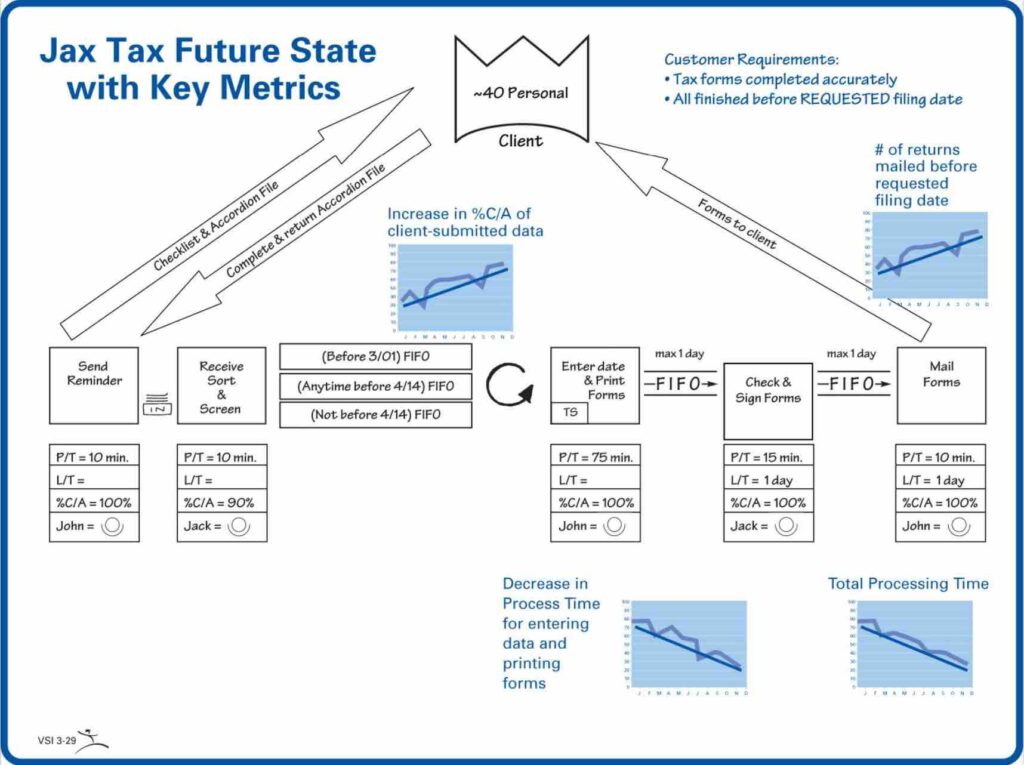
Value stream mapping typically begins with a team creating a current state map. This means capturing the actual condition of a value stream’s material and information flow. Subsequently, the team draws a future state map. That is to say a target image of how material and information should flow through the value stream.
Doing this over and over is the simplest and best way to teach yourself and your colleagues how to see value.
Value-stream mapping is most commonly used in lean manufacturing. However, managers in any industry can get value from it.
Watch an Introduction
Characteristics of a Lean Value Stream
Guideline #1: Produce to your takt time
“Takt time” is how often you should produce one part or product based on the rate of sales. Consequently, it is a proxy for customer demand.
Guideline #2: Develop continuous flow wherever possible
Continuous flow refers to producing one piece at a time. Operators immediately pass each piece to the next process step without stagnation in between.
Guideline #3: Use supermarkets to control production where continuous flow does not extend upstream
There are often spots in the value stream where continuous flow is not possible and batching is necessary. Resist the temptation to schedule these process via an independent scheduling function. Instead, control their production by linking them to their downstream customers through a supermarket-based pull system.
Guideline #4: Try to send the customer schedule only to one production process
By using supermarket pull systems, you will typically need to schedule only one point in the value stream. This point is called the pacemaker process. This is because how you control production at this process sets the pace of production for all upstream processes.
Guideline #5: Distribute the production of different products evenly over time at the pacemaker process (level the production mix)
Most assembly departments probably find it easier to schedule long runs of one product type and avoid changeovers. However, this creates serious problems for the rest of the value stream and customers, such as:
- Increases the lead time from order to delivery
- Swells in-process inventories
The more you level the product mix (aka “heijunka”) at the pacemaker process, the more quickly you will be able to respond to different customer requirements while holding less inventory.
Guideline #6: Create an “initial pull” by releasing and withdrawing small, consistent increments of work at the pacemaker process (level the production volume)
Too many companies release large batches of work to the shop floor processes, which causes several problems, such as:
- There is no sense of “takt” or pull from the customer to which the value stream can respond.
- Responding to changes in customer demand becomes very complicated.
- The state of production becomes difficult to monitor.
Establishing a consistent, level production pace creates a predictable production flow. Consequently, this allows management to see problems more easily and take corrective action faster.
A good place to start is to regularly release only a small, consistent amount of production instruction (usually between 5-60 minutes worth) at the pacemaker process and simultaneously take away an equal amount of finished goods. We call this practice a paced withdrawal. And the pitch is the consistent increment of work.
We calculate the pitch based on the packout quantity (the number of parts one finished-goods container holds) or a multiple or fraction of that quantity. For example, if your takt time is 30 seconds and your pack size is 20 pieces, then your pitch is ten minutes (30 seconds x 20 pieces = 600 seconds or 10 minutes). In other words, every 10 minutes: a) give the pacemaker process instruction to produce one pack quantity and b) take away one finished pitch quantity.
Current and Future State Example Maps
Value-Stream Map Zones
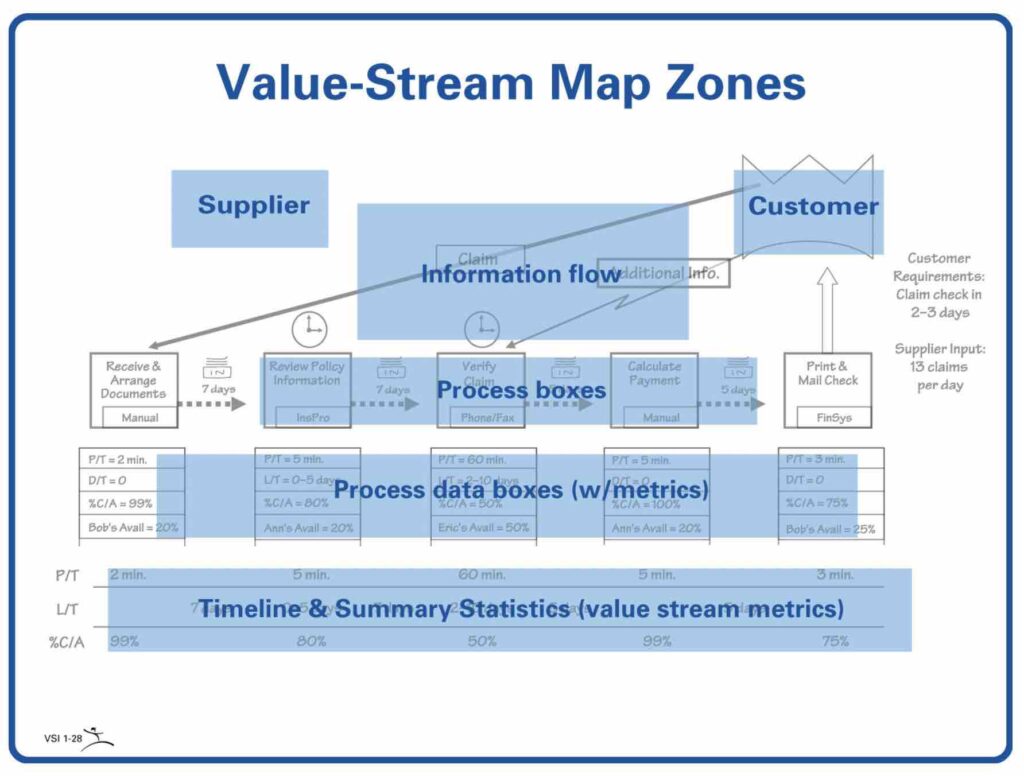
Information flow — tells each process what to make or do next and when to do it.
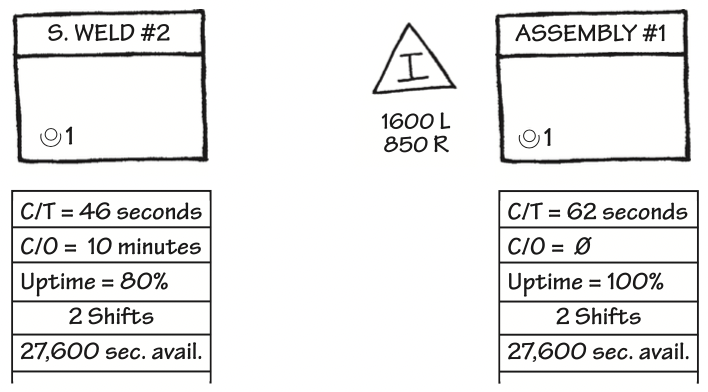
Process boxes — the steps of product or service delivery in a value stream. Because drawing a box for every process step would make the map unwieldy, use the process box to indicate one area of material flow. The process box stops wherever processes are disconnected and the material flow stops.
Process data boxes
- Cycle Time (C/T) — the time it takes an operator to go through all of her work elements before repeating them.
- Lead time (L/T) — the time is takes one piece to move all the way through a process or a value stream from start to finish.
- Uptime — the percent of time a machine is available for production
- Changeover time (C/O) — the amount of time required to setup a machine to make a different product or part number.
- % Complete and accurate (%C/A) — the percent of product completed with perfect quality in a process step.
- Availability — the amount of time a process operates over a single shift. This is often measured in seconds.
Learning to See Workbook
Value-stream maps are the blueprints for lean transformations and Learning to See is an easy-to-read, step-by-step instruction manual that teaches this valuable tool to anyone, regardless of his or her background.
This groundbreaking workbook breaks down the important concepts of mapping into an easily grasped format. The workbook, a Shingo Research Prize recipient in 1999, is filled with actual maps, as well as engaging diagrams and illustrations.
Learning to See Online On-Demand Course
A go-at-your-own-pace, web-based workshop faithfully based on the innovative content in the landmark Learning to See workbook that introduced value-stream mapping to the world.
Having a perfectly drawn current state map is not the point. The main intention of current state mapping is going through the process of trying to understand the dock-to-dock flow.
Why Value-Stream Mapping Is an Essential Tool
- It helps you visualize more than just the single-process level. You can see the flow.
- It helps you see more than waste. Mapping helps you see the sources of waste in your value stream.
- It provides a common language for talking about a process.
- It makes the decisions about flow apparent, so you can discuss them. Otherwise, many decisions and details just happen by default.
- It forms the basis of an implementation plan. By helping you design how the whole “door-to-door” flow should operate, value-stream maps become a blueprint for lean implementation. Imagine trying to build a house without a blueprint!
- It shows the linkage between material flow and information flow. No other tool does this.
Where to Start
- Select a product family
- Have one person personally lead the mapping effort
- Begin at the “door-to-door” level to capture the complete flow
- Consider both the material flow and information flow
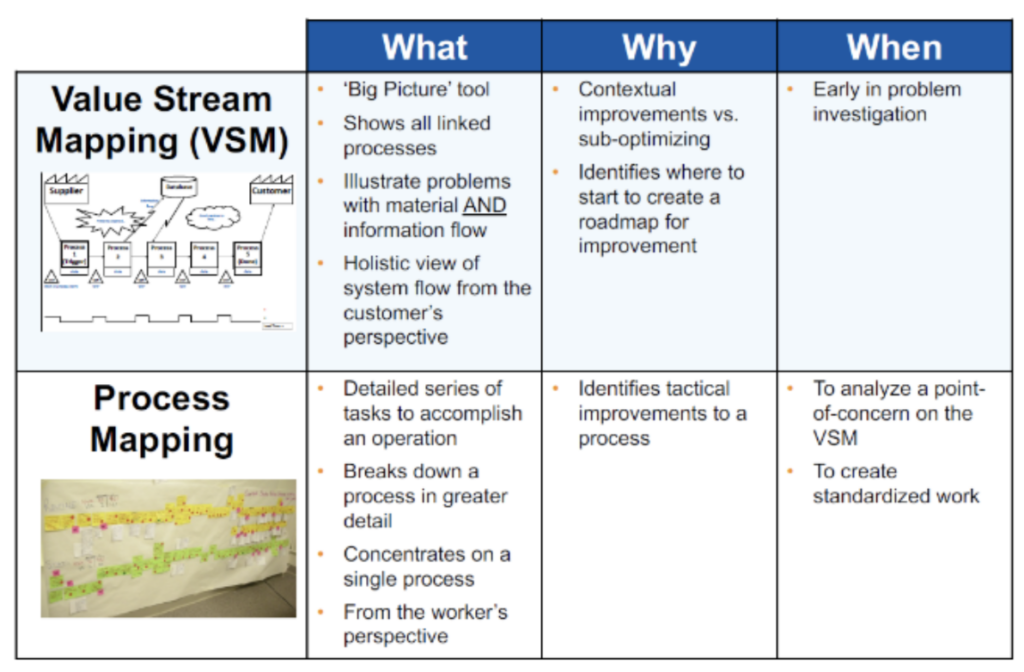
Value-Stream Mapping versus Process Mapping
Taking a value-stream perspective means working on the big picture and not just individual processes. In other words, it is about improving the whole not just optimizing the parts.
Examples across Industries
| Industry | Article |
| Manufacturing | Apples & Oranges: Mapping in a Low-Volume/High-Mix Environment |
| Healthcare | Using Value Stream Management to Better Care for Stroke Patients |
| Engineering | Why Value Stream Mapping is Essential to Product and Process Development |
Top 5 Articles
- 10 Tips for Getting the Most Value from Value Stream Mapping
- Keep It Simple: Value Stream Map at the Gemba
- Why You Need to See the Entire System
- Misunderstandings About Value Stream Mapping, Flow Analysis, and Takt Time
- Avoiding the Most Common Mistakes with VSM
Download value-stream mapping icons