
Making improvements using lean principles in a low volume/high mix (LVHM) manufacturing environment can be difficult, especially when determining where to start. However, some of the same tools used in traditional mass-production environments work equally well in a high-mix environment.
As the engineering manager for an LVHM organization in the medical device field, I found one of the keys to success was identifying groups of products by flow — especially during one project I worked on to fight long lead times and noncompetitive costs. In a sense, we stopped trying to compare apples to oranges and just looked at our products as if they were all the same. We would first work to identify all the products in a facility, department, or office and then define the flows. This task was probably the most time-consuming for us, as some facilities had as many as 4,000 products — some of which were only made once per year or less in quantities as low as five (excluding custom orders and prototypes).
We would then align the products by workflow. For example, in one manufacturing facility, we stopped grouping products by type, e.g., “hips,” “knees,” and “shoulders.” Instead, we grouped them by process flows, e.g., “Lathe-Vertical Mill-Vertical Mill,” or “Lathe-Mill/Turn-Mill,” or “Laser Etch- Non-sterile Packaging – Labeling.” The products might have been apples vs. oranges vs. pears in appearance, but if they all used the same flow, that was our starting point.
After grouping the products by workflow, we could start identifying the volume, takt time, and capacity required for each flow. Sometimes this meant grouping products A, C, and X together, even though they look nothing alike, and we traditionally considered them to be unrelated to each other. Grouping products by flow created smaller individualized value streams within the overall organizational value stream — some with 300 products, others with 50, and others with just one or two.
Once we understood this, we knew how many manufacturing “units” (e.g., machines, secondary processing, labor, etc.) we would need for each value stream. This information fed our capacity planning. Ultimately, our VSM looked something like the following image:
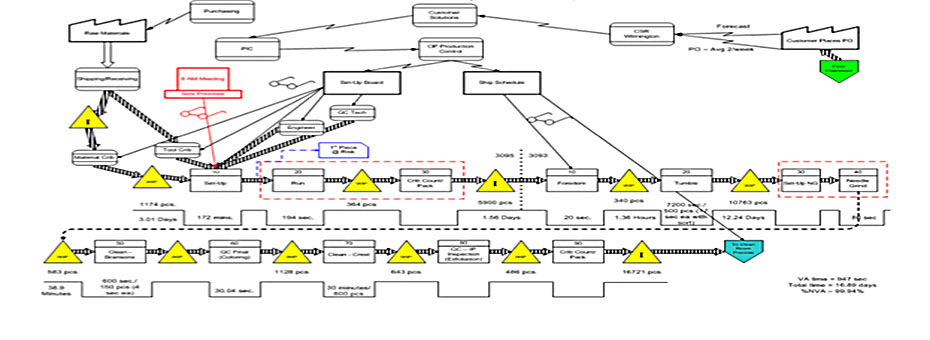
This overall strategic-planning work allows you to determine where to start value-stream mapping and what percentage of your business each flow represents.
Then, more critically, you can leverage your map for strategic advantage by adding current margins and variance reporting (if you have the data) of the combined value stream and detail by each smaller product family within the stream. So, for example, you could start making intelligent choices on which VSM will probably yield more significant wins for the organization.
We added that data, which caused us to focus on one combined value stream representing several hundred products. As a result, we reduced the average changeover time within the critical value stream from 10 hours to 30 minutes. While that’s not a single-minute changeover, it reduced wasted time between orders by 95%. And that reduction meant the difference between losing money and making a decent profit on the entire range of products.
We started seeing significant growth once we had defined and improved value streams representing 50% of our revenue using this strategy.
We started seeing significant growth once we had defined and improved value streams representing 50% of our revenue using this strategy. We targeted one year for this initial part of the transformation after figuring out how many “events” we would need to get these changes done and get a large percentage of our staff involved in the cultural change. And things only got better from there. Once we improved value streams representing 80% of our revenue, the sky was the limit.
I challenge you to put aside some time to intentionally consider your organization’s value streams — or your product families if you don’t group products by value stream — and map your process flows. You might find hidden opportunities within your current assumptions, or you’ll find a starting point for transforming your LVHM business.
Editor’s Note: This Lean Post is an updated version of an article published on October 27, 2015, one of the most popular posts about this vital lean practice.
Learning to See Using
Value-Stream Mapping
Develop a blueprint of improvements that will achieve your organization’s strategic objectives.


it is interesting that I had this before. In normally way, VSM starts from product family. I think “product” is kind over focus. It is similar that people over focus on “production” from “Toyota Production system”. On one hand, we have to satisfy customer demand. Here “product” is typical meaning of “product”. While looking internally, we need to find a way to make customer satisfied in term of “product” as well as not make ourselves trouble in term of production. So balance between product family and process family together help determine the flow.
I did this many time before.
Have you heard about Value Network Mapping? Production Flow Analysis? Job Shop Lean? Production Flow Amalysis and Simplification Toolkit? Schedlyzer? This work you present can be done better if you skip using VSM.
I assume that you would need the cycle times first before creating the VSM for it?
What if the cycle times are not available as in a LVHM environment this would be very challenging?
In LVHM, cycle times often are not available. Estimators need to be accurate when quoting and the estimated times are used.
Isn‘t this the classical Part-Quantity-Process-Routing (PQPR) approach?