How to See Invisible Work (and Wrangle It)
In Part 1 of this two-part series, we established a core operational truth: you can’t improve what you can’t see. But surfacing invisible work is only half the battle. Visualizing flow without taking decisive action creates the dangerous trap of the “ignored andon” — where problems are exposed for all to see, yet left unaddressed. True progress requires both the systems to reveal hidden work and the commitment to actively wrangle it. Part 2 explores practical ways to illuminate invisible work across your organization and build the discipline needed to act on what you discover.
Methods and Mechanisms for Visibility
To combat the challenges of invisible work, organizations need a life support system for their invisible work. This life support system helps to make the invisible visible and is a combination of:
- Measurement: Quantify what we can and qualify what we must (e.g., tracking flow metrics to make invisible actions visible as trends), which can lead to a 1% improvement week over week and adds up to over 40% improvement annually.
- Refinement: Break big problems into small ones and clarify the vague, which reveals insights about viable solutions. A big rock hides assumptions, inertia, and uncertainty; eight smaller items move more easily and are less daunting.
- Definition: Explicitly draw boundaries and criteria, such as entry and exit criteria, to make invisible assumptions negotiable and consistent. The result is decreased cycle time and rework.
- Modeling: Establish shared mental models and frameworks to align, simplify, and zoom out and in. Representing tiers of architecture allows us to step up or down in conversation. Multiple meetings gradually get replaced by a clear artifact; conversation is more focused.
- Categorization: Create clarity and definition around types, which provides a useful reference that makes identification and action easier and more accessible. Lean has been doing this for decades with Taiichi Ohno’s seven wastes (rework/correction, waiting, overproduction, overprocessing, conveyance, inventory, and motion). With simple and rapid identification as part of the organization’s common vocabulary, it becomes possible to intentionally seek out waste and define specific mitigations by category.
- Mapping: Build shared views and connections across perspectives (e.g., a value-stream map) that gets individuals to look upstream and downstream of their work, while at the same time pulling and converging hidden insights from individual minds. Even identifying and removing a single constraint can quickly drop lead time by 30%.
- Facilitation: Be willing to invite third-party assistance to see what’s too close to recognize, or too far to reconcile. An outside perspective can help a team communicate; rather than wasting time talking past each other, stakeholders make decisions.
- Conversation: Reveal what’s not shown, and surface emergent insights. Humility, respect, and active listening reveals hidden opinions and biases, while prompting exploration. Silos that can cause rifts are broken down by emergent alignment.
Value-stream mapping is a mechanism that works across every one of these dimensions, creating shared artifacts that successfully translate abstract digital activities into visual, unified assets.
- It avoids a costly investment in AI acceleration that would exacerbate a hidden constraint. We hear: “That could have been months of effort and thousands in investment just to make things worse.”
- It brings distant but dependent silos into alignment and cooperation. We hear: “We’ve never been a part of the same workshop before.”
- It creates visibility where none existed before. We hear: “I’ve been here for 19 years and this is the first time I’ve seen our process end-to-end.”
- It brings abstract measurements to life, and provides a backbone for putting them in context. We hear: “I can see how age makes us more proactive, and how cycle time fits into the big picture.”
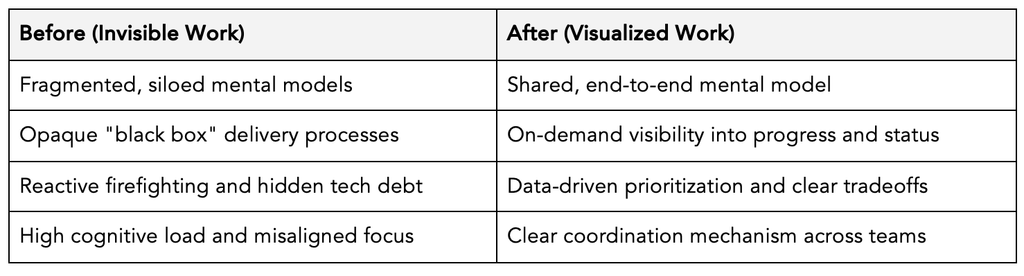
Seeing the whole value stream helps us align and prioritize efforts, but seeing workflow on a daily basis is the other side of the coin. By tracking invisible work types, like security and technical debt, as first-class citizens, they finally become visible. This visibility immediately provokes necessary, data-driven conversations about priorities, budget allocation, and realistic roadmaps. The value-stream mapping in flow engineering brings one view to invisible work, but it starts with outcome mapping to surface and align invisible perspectives and opinions. It flows naturally into many other views to create and expand visibility and context, such as Wardley mapping (strategic capability evolution), customer-journey mapping (grounding streams in customer experience), and user needs/job-to-be-done (JTBD) mapping (align workflows with actual user outcomes).
The Obeya Benefit
A prime example of making invisible knowledge work visible is Toyota’s “obeya” (big room) system, created during the development of the first Prius. Facing a completely new architecture across product design, engine, transmission, chassis, and body engineering, traditional handoffs would have resulted in lost context and wasted time. To break down information silos, Toyota brought cross-functional teams into a single room where all project data, timelines, and bottlenecks were mapped visually on the walls. Drawings, physical models, and concepts were displayed openly so everyone could see the big picture. By turning hidden, distributed unknowns into tangible, shared artifacts, this radical transparency exposed hidden inefficiencies and cut vehicle development time by 50%.[1] While obeya existed at Toyota before this time, the Prius team revolutionized the concept into a powerful method for making invisible knowledge work visible in product development.
Even with physical factory work, making operational status clear requires explicit frameworks. Wastes like rework, waiting, overproduction, and overprocessing were physically present, yet supervisors and workers often overlooked it. Taiichi Ohno established the seven wastes framework specifically to help teams recognize inefficiencies hiding in plain sight.
Kanban visually communicates work status in a way that enables action, and the best kanban systems make queueing, aging, and other invisible drains on work obvious. They create a pull system and motivate progress naturally by what they make obvious. Its visible signals directly connect capacity and demand information to immediate action.
Knowledge work requires that same link between visibility and response. Rendering unfinished tasks on a board helps teams understand current status, but real impact requires clear rules for starting work, limiting work in progress, and addressing blockages. Visibility adds value when it prompts responsible teams to spot bottlenecks and take targeted action.
Standardized work creates visibility by exposing operational deviations. Establishing clear baselines makes variations and anomalies obvious. Mapping out actual work on-site — detailing process steps, timing, safety considerations, and quality checks — surfaces issues that would otherwise stay hidden in daily routines.
Value-stream mapping (material and information flow) expands this visibility end-to-end, tracking operations from initial order to final delivery. It extends beyond individual workstations, helping leaders schedule work effectively and pinpoint “hidden factory” rework loops that cross department boundaries.
Transforming digital work from a chaotic, invisible process into a smooth, measurable flow requires intentional design. When work consists of code and data rather than physical parts, visual systems substitute for physical senses to detect bottlenecks, alignment gaps, or system breakdowns. By surfacing hidden assumptions, mapping value streams, and fostering psychological safety, organizations can make invisible work manageable — rescuing teams from constant firefighting and aligning daily effort directly with customer value.
From Visibility to Effective Action
There are real consequences to revealing insight if you lack the authority, motivation, or capability to address the conditions made visible. An ignored alarm just becomes a hassle and another signal of dysfunction — a broken window signifying a neighborhood in decline. I’ve sat in too many retrospective meetings where negative conditions are discussed, and the group resigns itself to “try harder” or “do better.” This behavior not only allows negative conditions to persist, but it saps the empowerment and motivation of the team. Teams thrive when they exercise agency and learn by taking action.
Revealing invisible work without the capacity, authority, or mechanism to act upon it is counterproductive. When team members see bottlenecks, technical debt, or systemic delays highlighted on dashboards every day but lack the empowerment or mandate to resolve them, visibility breeds cynicism, anxiety, and learned helplessness. A dashboard displaying continuous red alerts without driving intervention quickly becomes background noise; teams adapt by tuning out the warnings. Before instrumenting new metrics or rendering work visible, establish a fundamental guiding principle: never measure what you are unprepared or unable to act upon. Instrumenting unactionable telemetry wastes operational energy and demoralizes the workforce.
High-tech dashboards and elaborate mapping exercises cannot fix an organizational system paralyzed by systemic inaction. When visible problems go unaddressed, the root cause is rarely a lack of awareness — it is typically a lack of psychological safety, conflicting management incentives, ambiguous ownership, or over-allocated capacity. Investing in visibility tools before resolving these underlying friction points only amplifies exposure to organizational dysfunction. Leaders must first remove the structural barriers to action — granting teams explicit authority, reserving capacity for operational improvements, and aligning performance incentives — so that when invisible work is exposed, teams are equipped and encouraged to respond immediately.
To understand the difference an explicit response mechanism makes, consider how two organizations handle aging code reviews and security vulnerabilities:
- Without an effective response mechanism: A software group deploys an automated compliance dashboard that flags aging code reviews and backlog security vulnerabilities. However, engineering leaders continue to evaluate teams strictly on feature output speed, with zero capacity allocated for remediation. Developers watch alert counts climb on the board, feel powerless to pause feature work, and eventually mute notification channels. Visibility becomes a liability, and cycle times and security posture remain completely unchanged.
- With an effective response mechanism: A software group implements explicit WIP (work in progress) limits paired with an automated triage protocol. When a pull request remains unreviewed for over 24 hours or a high-severity vulnerability is logged, the system triggers a pull signal. Workflow policy dictates that new feature intake pauses, and a dedicated pairing rotation steps in to triage and unblock the queue. Because capacity is intentionally reserved and failure to act halts downstream work, visibility directly drives immediate, coordinated resolution.
Getting Started: Small Wins for Big Visibility
You don’t need a multimonth overhaul to begin illuminating invisible work. Teams can build immediate momentum through low-barrier, high-impact steps:
- Draw an outcome map: Quickly surface a valuable target outcome, key benefits, obstacles, and next steps to get moving in the same direction. Put your visibility efforts in the context of business value.
- Run a 90-minute value-stream mapping exercise: Gather key cross-functional roles to draw out the high-level path from request to delivery, highlighting obvious handoffs and waiting periods.
- Make a metric ledger: Working backward from strategic objectives or KPIs to individual metrics, gather what’s currently measured, by whom, for what, and why (including what action they drive).
- Make unplanned work visible: Track interruptions, emergency fixes, rework, and reactive tasks for two weeks to quantify hidden capacity drains.
- Define explicit entry and exit criteria: Clarify handoff expectations between key stages to eliminate hidden assumptions and reduce rework.
- Play an interactive learning exercise: Use quick simulations like the Flow Engineering Game, Penny Game , Ball Point Game or TWiG to demonstrate flow visually in a safe, engaging setting.
Ultimately, transforming modern knowledge work requires a complete bridge from visibility to action: you cannot improve what you cannot see, but visibility alone is meaningless — and even counterproductive — without the organizational commitment to act. Illuminating hidden queues, dependencies, and debt in digital workflows is only the first step; true operational excellence requires pairing end-to-end transparency with explicit response mechanisms and structural empowerment. By coupling the systems that expose invisible work with the discipline to resolve issues as soon as they appear, organizations can break free from reactive firefighting, safely harness AI-driven acceleration, and turn hidden effort into measurable, sustained value.
My thanks to Art Smalley for sharing his advice and experience from Toyota.
[1] James Morgan and Jeffrey K. Liker, The Toyota Product Development System (Productivity Press, 2006).
2026 Lean Global Connection
The world's largest online lean event.