Visualization is a good thing. We all know that. And many of us in the Lean Community practice it, to greater or lesser degrees of effectiveness. Among other benefits, making visible such things (see examples below) as pace or quality of work makes it easier to solve problems and sustain gains. To quote Dr. Thoralf Sundt of Mayo Clinic, “If I can see it, I can fix it.” The reverse must also be true – it’s hard to fix what you can’t see. This past month I ran across three examples of visualization – good, bad, and ugly – to share with you.
The Good
The first case involved a young woman doing a quality check at the end of an assembly line of electromechanical components. For two years she had been collecting the same quality information. Performing a series of checks, she would confirm that all connectors were firmly attached, components all assembled and in working order. As she found problems, she recorded them into a computer database, which was then compiled into a larger database. The database was reviewed, analyzed, and results fed back to the production group and others.
Like this:

There was no direct connection between the workers making the errors and the inspector finding the errors, and the information that was eventually shared followed a long and irregular time line. Management began looking at the situation because of a perceived “lack of motivation” in the workers and inspectors. As plant management explored various means of increasing worker engagement and motivation, a quality engineer noticed the disconnect between the workers and feedback on their performance. Problems that could have been fixed right away took days and weeks to even surface, and the time required for errors to be corrected could take much longer. The engineer wanted to fix his technical problem.
It was the woman doing the inspecting who made the suggestion. “How about,” she offered, “instead of me just entering the error information into a database, I tick off each example as they occur on this unused white board?” She found it easy to simply make a quick note of each problem on the board, and to enter it later into the database.
Like this:

What happened next was unplanned. The production line leader started noticing what she was doing. He was a little nervous, seeing the performance – the mistakes – of his team members displayed for all to see. The next suggestion was his. “How about,” he offered, “if I bring my team over to take a look at the board at the end of each day, so we can see how we are doing?”
What happened next was interesting. As the inspector and the workers looked at her board together, they started to talk about it. Turned out, one of the workers who had been committing many of the mistakes mentioned that he had always had a problem with one of the connectors. The two ends of the connector were very small, his hands weren’t, and the space he had to work in was very tight. A recurring problem had been uncovered, its cause identified, and the engineer was delighted as he knew he could make the situation better with a relatively easy engineering adjustment. Other problems that got raised were often even easier to remedy, often right on the spot.
What motivates?
What happened next was even more interesting. As the inspector and workers got to know each other better, instead of waiting until the end of the shift, they started stopping by during their lunch break. They could see how they had done so far in the shift. Before long, the inspector and the team were engaged in a day-long exchange of how production was proceeding. Importantly, workers were struggling less while producing more and the inspector’s very role in the process had changed dramatically. Management had sought to improve motivation and they did. But not at all in the way they had expected. Turned out that what was needed to increase motivation among the employees was more effective support in helping them be successful and engaged in their work.
The Bad
The second case involved a production analysis board (PAB) that seemed, on the surface, to be working well. The production plan was laid out on an hourly plan versus actual basis. Ample space was allocated on the board for employees to capture their problems, ideas, remarks. But, a couple of things didn’t look right and a conversation with the team leader revealed that the board wasn’t working well. A deeper conversation and a little observation showed why.
All rework is bad – rework of worker engagement is worst of all.
The first problem in this case was one that is all too common. Management had asked the workers to write down the problems they encountered in the course of performing their daily work. A noble effort on the part of well-intentioned managers. The problem was what happened next, which was … nothing. There is little more demoralizing to a workforce than to gear them up to engage their minds only to miss-shift and find yourself going in reverse. The workers had no difficulty finding problems to capture on the dry erase PAB. The difficulty came when management failed to respond to them effectively. The list got longer. That was bad. Then, the list got shorter. But, that wasn’t good – it got shorter not because management responded by clearing off the items; the list shortened because the workers stopped reporting. A waste of time, they said.
Next time management tries to engage these workers, they will find the workers – who were convinced they had been scammed again – to be more skeptical than ever.
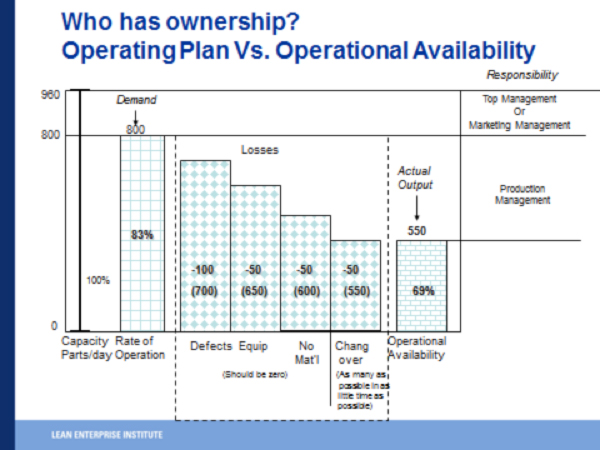
What to say if you want to create waste and hide problems: “Produce as much as you can.”
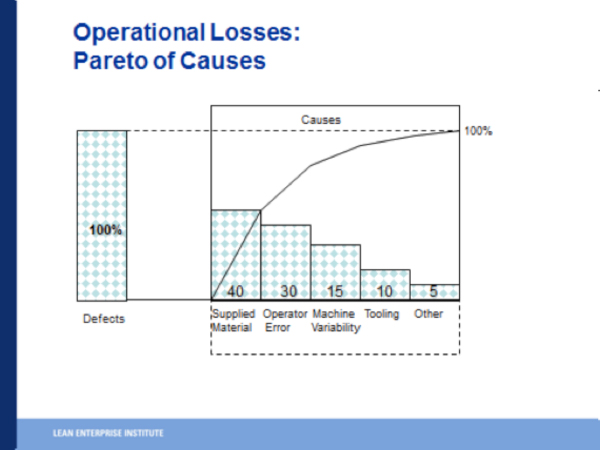
The next problem in this example could be discerned from a close look at the plan versus actual – P/A – numbers on the board. The plan numbers showed no change from day to day, just steady plan to produce 240 units per shift, further broken down into 30 per hour. Okay, maybe that’s all right. Then, the actual numbers – records of actual production – were all over the map. That was interesting and could point toward any number of problems – identifying those is the very purpose of the P/A board. But, exploring just a little further, it turned out that the plan numbers weren’t real at all. Due to various product issues, the truth was that there was zero expectation of producing 240 units per shift. Actual hourly output ranged from 10 to 40, daily from 120 to 240, with one instance of 260. The explanation? “Well, we are having a lot of engineering changes, so we can’t meet our demand, but the target is still 240.” So, I queried, “How many do you actually expect to produce today – how many do you want to make?” The reply, “Well, we don’t know how many we can make but we want to make as many as we can …”
It is critical to provide unambiguous expectations – targets. “Today, we need to produce 240 units, 30 per hour. ” Not 239. Not 241. 240. The unambiguous target makes problem solving easier – “We only produced 230 of the targeted 240 units – exactly where did the missing ten units go?” We can pursue the cause-effect relationship between the missing 10 units and the various factors that cause them. As we improve our skills, we can tighten the management response time (instilling the all-important sense of urgency) to hourly and even less. The point here is that without a clear target, it is difficult to do PDCA. There is no PDCA without the P – that is precisely what “plan versus actual” is all about. The number that I, as leader, write in the P space represents the number that I am – no kidding – asking the team to produce. Problem solving is the challenge that I am asking them to accept in order to meet the target. (There is a role for “stretch goals,” but that is a different discussion.) Instructions such as “Produce as many as you can” create a dynamic of ambiguity, encourage excuses, and lead directly to those incessant cycles of firefighting that we wish to avoid.
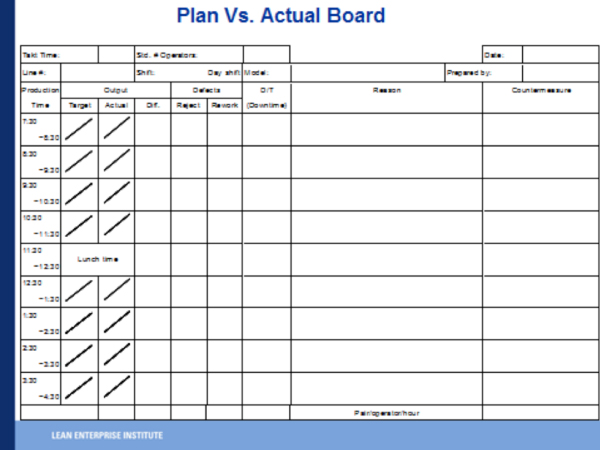
See PAB explanation on pages 110-111 in Kaizen Express
The Ugly
For an interesting example of ugly visualization, check out this blog post.
This example reminds me of “lean offices” that shadow board every item on every cubicle desk, even while the flow of work remains murky, problems out of sight, and the way forward completely invisible.
Better
Making visible normal from abnormal, arranging the physical environment to represent the way we want to work, and ensuring that our way of thinking about work is embodied in the way we configure our physical environment are methods to help us tap into natural human motivations. Random visualization will yield random results and unintended consequences. The countermeasure is to make sure each visual artifact has a clear and specific purpose, defined owners and users, along with rules and a cadence of usage. LEI’s Dave Logozzo recommends these three simple questions to make sure your visual boards are useful and can deliver the intended consequence:
- What is the purpose?
- Who is it for?
- How often do you use and/or respond to indications of abnormality – what is your PDCA pulse?
Far better than shadow boards (nothing against shadow boards – I love them!) that make sure no one walks off with our staplers, let’s focus on this: arrange the flow of work so that problems are highlighted as they arise, enabling and encouraging individuals and teams to tackle them right away. Visualization which supports that is visualizaton I can support.
John
John Shook
Chairman and CEO
Lean Enterprise Institute, Inc.
jshook@lean.org
PS: Another example of visual management can be found right here at LEI. Since moving into our new offices in March, we are redoubling efforts to make our work as visible as possible. We invested in white boards of various kinds, white board paneling (metal, so it is also magnetic), a smart board, and painted many of our walls with white board paint. When you visit us, you will be able to see our annual work plan – objectives, activities, timeline – on a 3×4 meter wall.
What we do here is office work and neither the work volume requirements nor the quality performance indicators are as crisp as on the operations examples above, but we’re endeavoring to make them as crisp as appropriate. Since we plan to offer more workshops in our new training room (as I write this, David Verble is teaching a workshop on Change Agent Skills and in July Mike Rother and team will lead a three-day Improvement Kata workshop), I hope you will find an occasion to visit us soon and give us your feedback and improvement ideas for our visual office. You can tell us if we are good, bad, or ugly.